A New Tool for Interactive Comparative Analysis of Aerosol Data
December 10, 2014
Critical data on atmospheric aerosols is constantly being collected from space (by instruments like MODIS, OMI, and VIIRS) as well as from ground stations like AERONET: the Aerosol Robotic Network. A system called “MAPSS” (Multi-sensor Aerosol Products Sampling System) enables scientists to perform comparative analyses of collocated spaceborne and ground-based observations. However, exploring and reporting numerous statistical results generated by MAPSS analysis over a broad range of sensors and hundreds of AERONET stations is a very complex problem.
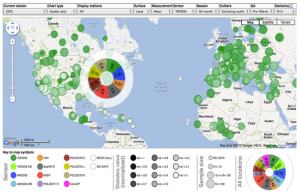
With this challenge in mind, SESDA 3 scientists and engineers helped to develop an interactive MAPSS Statistical Explorer web tool. All aerosol ground stations are displayed on a Google map. By clicking a given site, a panel pops up showing the values of an uncertainty parameter for all sensors compared to AERONET, with many different options for comparisons. In addition to the statistics presented in the panel, a user can also obtain scatter plots, time-series plots, or relevant data files, enabling further exploration of uncertainties.
The MAPSS Statistical Explorer can be accessed at http://giovanni.gsfc.nasa.gov/mapss_explorer/. For additional information about the MAPSS system and data, please refer to the MAPSS (http://giovanni.gsfc.nasa.gov/mapss/) and AeroStat (http://giovanni.gsfc.nasa.gov/aerostat/) portals in Giovanni.
Comments are closed.
-
Article Details:
Posted on: Wednesday, December 10th, 2014
Posted in: News, SESDA News
Subscribe: RSS 2.0
Comments: No Responses -
Recent News:

